Read it, or argue with it
A DCF in a spreadsheet is something you read. A DCF in a dashboard is something you can argue with. That difference was the whole point of this build.
Context
A valuation model for a services back-book lived in a static spreadsheet: fifteen years of assumptions about volume, conversion, margin maturity and discounting, each buried in cells nobody could interrogate in a conversation. I rebuilt it as a live, interactive tool.
The published version runs on invented figures with the business genericised; the mechanism is exactly what shipped.
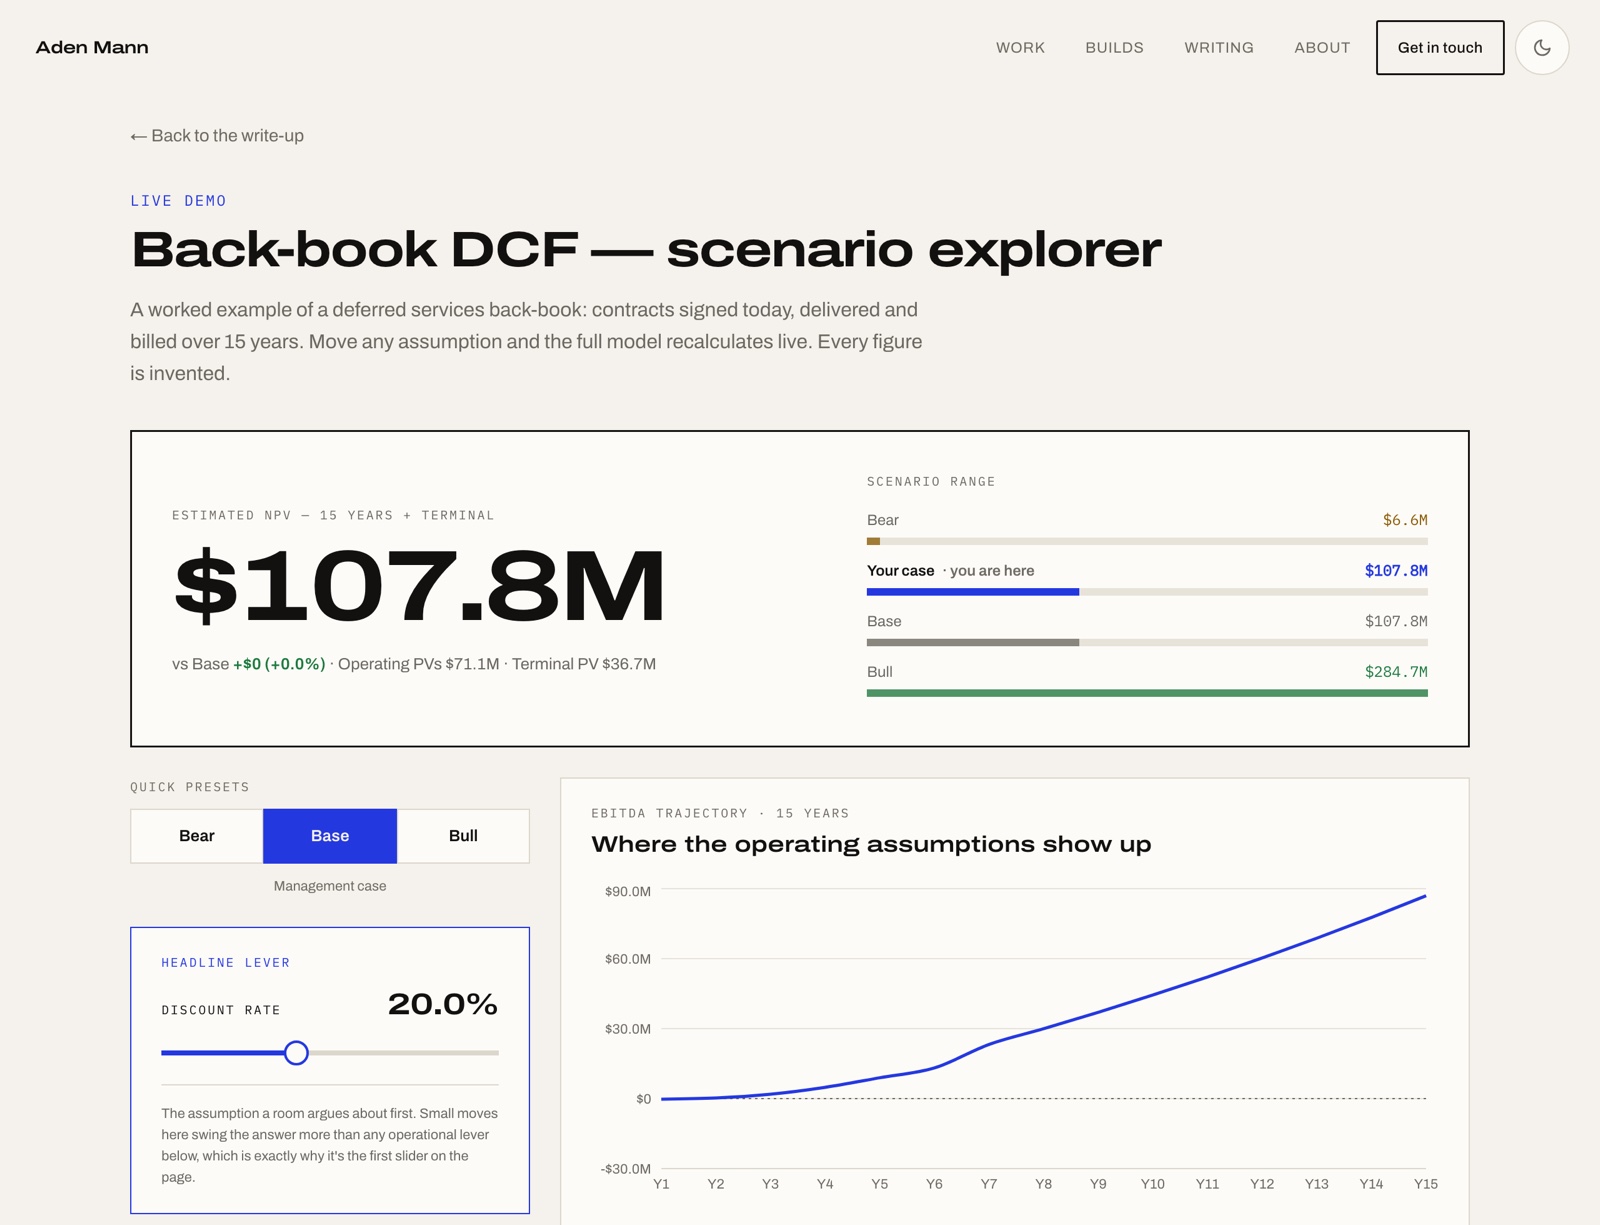
What it does
- Bull / Base / Bear scenario toggle, so the reader can move between growth assumptions instead of accepting one management case at face value.
- Discount rate as the headline lever, the first slider on the page, because it's the assumption a room actually argues about, not a buried cell three tabs deep in the source model.
- Secondary sliders underneath the valuation: margin trajectory, attrition, conversion and the take-rate assumption, each editable in real time rather than fixed.
Every change recalculates the full model live, so a claim like "if margin only gets to X, the valuation drops by Y" is something the reader can test themselves in the room, not something they have to take on faith.
The point
Anyone can build a DCF. The actual problem worth solving was making one assumption falsifiable on the spot, rather than asserting a number and hoping nobody pressed on it.
Stack
React dashboard, scenario-driven financial model recalculating client-side, deployed as a route on this site.